
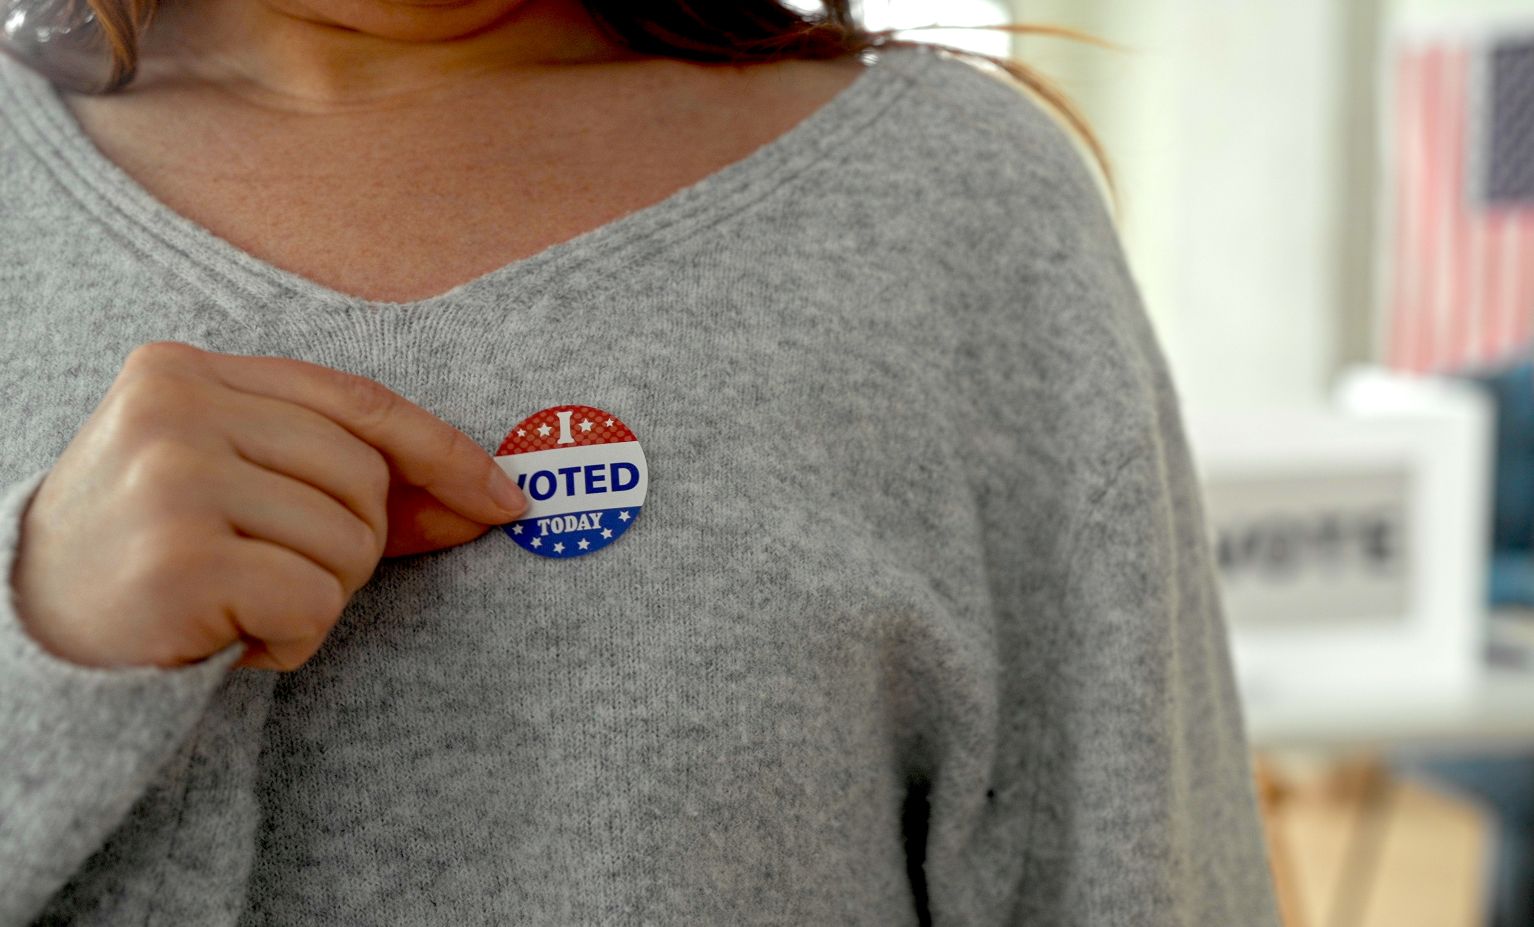
How Do Moderate Women Plan to Vote in 2026?
The midterms are less than three months away and the stakes couldn’t be higher to elect a Congress that will put checks on unbridled executive action.
35 Senate seats are up for election, as well as all 435 seats in the House of Representatives. The outcome of this election will decide which party controls Congress, and thus who controls the agenda, giving them influence on what bills are debated, voted on, and passed into law. That’s in addition to the hundreds of local and state elections on the ballot which will shape decisions on local infrastructure, schools, taxes, and public safety.
This election is our chance to elect leaders who will protect our democracy and our future.
Why Ideologically-Moderate White Women?
Our audience represents 24% or more of the vote share in some of the most competitive swing states and districts across the country. As November approaches, we are working to understand their plans to vote.
Do Ideologically-Moderate White Women Plan to Vote?
Overall voter turnout, especially for a midterm election, is consistently low. In 2022, just 52.2% of eligible voters cast a ballot (slightly lower than the 53.4% turnout in 2018). That means that nearly half of all eligible voters did not cast a ballot.
We know from past elections that our audience votes at higher rates than the general population, with 80% of those surveyed reporting that they voted in 2024 (compared to 65.3% of the general population).


So it was encouraging to see similar numbers even in an off year. As of July, 81% of those surveyed said they plan to vote in the midterms! However, that’s down from a high of 87% in January (from a different sample of respondents). This potential trend of people who do not plan to vote is concerning, and may reveal an underlying lack of trust in elections, and/or a lack of candidates who speak to their needs.
This is especially interesting since we know our audience thinks this election is important. In July, 64% of respondents said that which party wins control of Congress matters a lot, and only 11% say it doesn’t matter at all.

There is an important disconnect here. While 89% of respondents think it matters which party wins control of Congress, only 81% say they plan to vote in the midterms. Exactly why that discrepancy exists is—as of yet—unclear, but it could be connected to a lack of faith in election integrity, disappointment with the candidates they have to choose from, or a lack of civic self-efficacy, a belief that their vote will not make a difference.
Who Does Our Audience Plan to Vote For?
Beyond whether they plan to vote, it’s important to understand how our audience plans to vote.

Since the beginning of the year, we have seen a decrease in the percent who plan to vote Democrat and both increases and decreases in the proportion who plan to vote Republican.
While these surveys were given to different samples of our audience, and so don’t show change in individual voting behavior, they give us insight into which (if either) party appeals to our audience.

The results of the vote choice survey closely align with the results of this question we posed in June. Over a quarter of our audience does not feel like either party cares about people like them, likely fueling their indecision and/or unwillingness to vote in the election.

We also know from our May survey that a majority of our audience views both the Democratic and Republican parties unfavorably and so the high number of women who do not plan to vote for either party is not surprising.
So What Are Undecided Voters Looking For?

About a quarter of our audience plans to vote, but is not yet sure how they’ll cast their ballot—they are the true “undecideds,” people who have not yet found a candidate who speaks to their concerns plainly and specifically enough to earn their trust and their vote and may feel disaffected from both parties.
To gain further insight, Galvanize Action Executive Director Jackie Payne spoke with a group of women and asked them what they are looking for in an elected leader. Take a look!
Each of these women has a different idea of what an ideal candidate is like, but across the board, they wanted someone who will offer real solutions for real people, not be swayed by money.
We also heard a sense of defeat. We heard a mention of a feeling like they have to vote for the lesser of two evils, and that they don’t have a lot of hope that their problems will be solved. This corroborates the survey data, that many feel no one is looking out for them or their interests.
What is Galvanize Action doing?
It’s important that our audience understands that their vote is important and their voice matters. We are working hard to show our audience who does and doesn’t have their backs, by speaking to their concerns about affordability, corruption, and fairness.
If you haven’t already, check out our latest ad where we used true crime framing that we know resonates with this audience to make it clear who is making their lives harder.
The importance of this election cannot be overstated, and we need this audience’s voices to be heard in order to elect leaders who are going to provide the real solutions that working families need.


